Time Machine as a Debugger
Adrian Sutton
 I’ve had a couple of articles open to remind me to blog about them for a while now – one from Tim Bray’s Android Diary and a response to it from Nick Kew. The key part of Tim’s post:
At a deep level, debugging with print statements is superior to all other approaches. Which is good, because we seem to be stuck with it. Firstly, I’m very strongly against debugging via System.err.println – you should have a logging system in place instead and just add extra messages to that. That way if you accidentally check them in, at least they go to the logs and are hidden at DEBUG level rather than annoying everyone all the time by going to System.err.
Apart from that minor quibble though, I’m a big fan of the println debugging camp. I just never found debuggers to be particularly useful. In thinking about this I think I’ve really struck on the key problem I have with debuggers and a really neat solution.
The key problem I have is that when you’re in the middle of a debugging session it’s really hard to keep track of where you’re up to and what the state is and whether you want to step over or into this particularly function. If you accidentally step over a function you meant to step into you have to go back and start all over again because the step backwards button, if available at all, is generally pretty useless. On the other hand, if you just print a bunch of stuff out, you can easily scroll back and forth through the output at your leisure to understand what’s going on. The debugger is like keyhole surgery – very accurate but very limited view. The println approach is like a MRI – much more of a general view, but you may not be seeing the entire picture. Fortunately, with println you get to decide which bits you see and which you don’t as you can always print out more data.
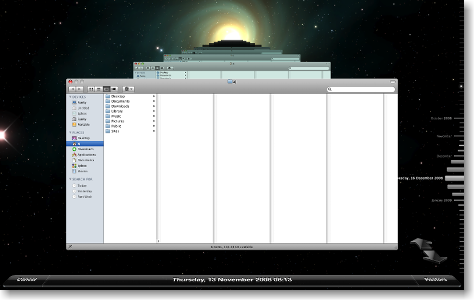
The solution is to change the debugger from something that lets you view the problem as it’s running, to something that records the program as it runs then lets you watch a replay. I’m imagining something like the Time Machine interface, where you can scroll back and forwards through time and see what the call stack was and what the value of variables were at that point in time. Matching it up with a screen recording (and/or console output recording) would let you see what you were doing at that point as well.
While I’m sure it would significantly impact performance to record all this detail as the program is run, it would be incredibly useful – just reproduce the bug once and then roll back and forward over it as many times as you want, with all the detailed information you want, until you identify what the problem is.
How is it that I’ve never heard of something like this before? It seems so obvious…